Low Carbon Hub Thermal Imaging Training workshop with Dale Hoyland, 28 February, County Hall, Oxford.
Author
![]() Cathy Ryan
Cathy Ryan
Publication date 30 March 2023
With the cost-of-living crisis and the energy price rises making it increasingly important to heat our homes efficiently, many of our community groups are carrying out thermal imaging projects in their communities.
Thermal imaging provides a visual and engaging way of introducing people in a local community to home energy efficiency and we were delighted to organise a thermal imaging workshop for community groups at County Hall, led by Dale Hoyland, Retrofit Team Leader for Oxfordshire County Council.
The workshop was filled to capacity with both Low Carbon Hub community group members and CAG groups, with a range of knowledge, from complete beginners to those with thermal camera experience who were hoping to develop analysis of their images. Some of Low Carbon Hub’s trained volunteer Energy Champions took part in the workshop to increase their confidence to offer a thermal imaging campaign to complement the Energy Advice programme in their community.
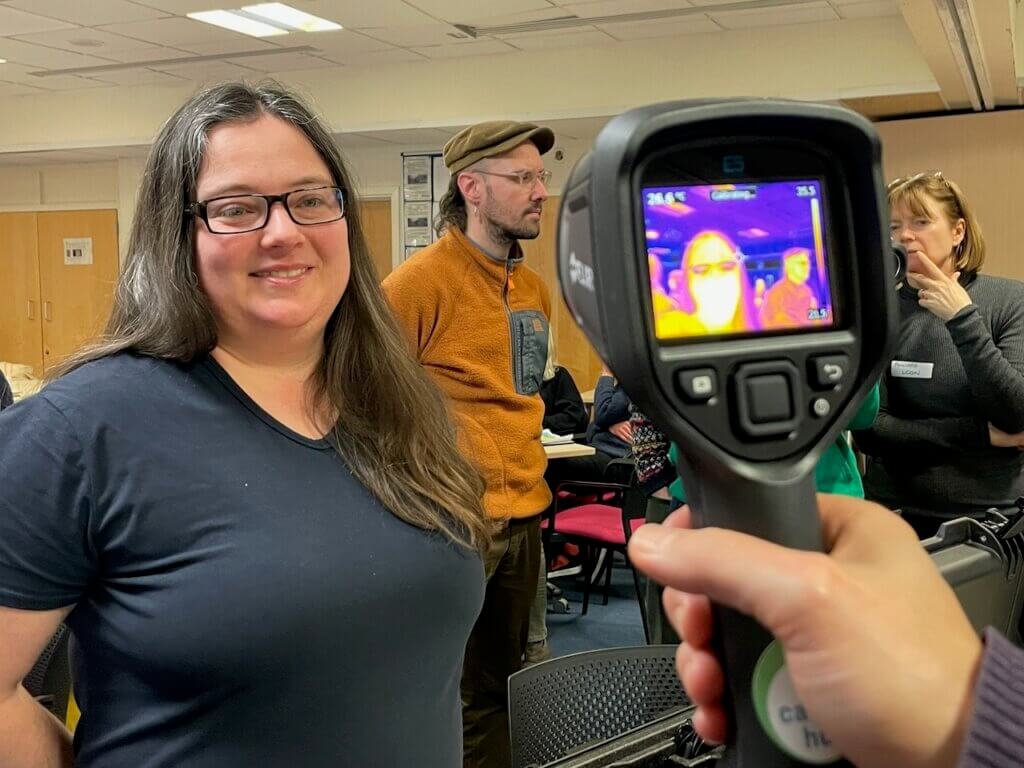
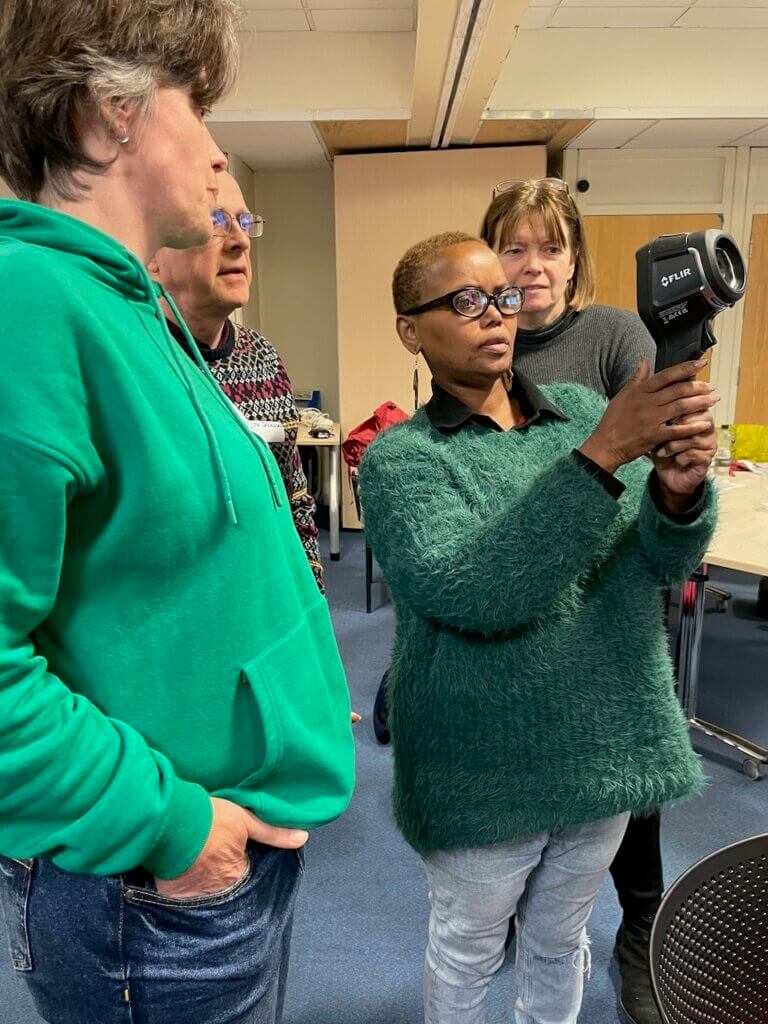
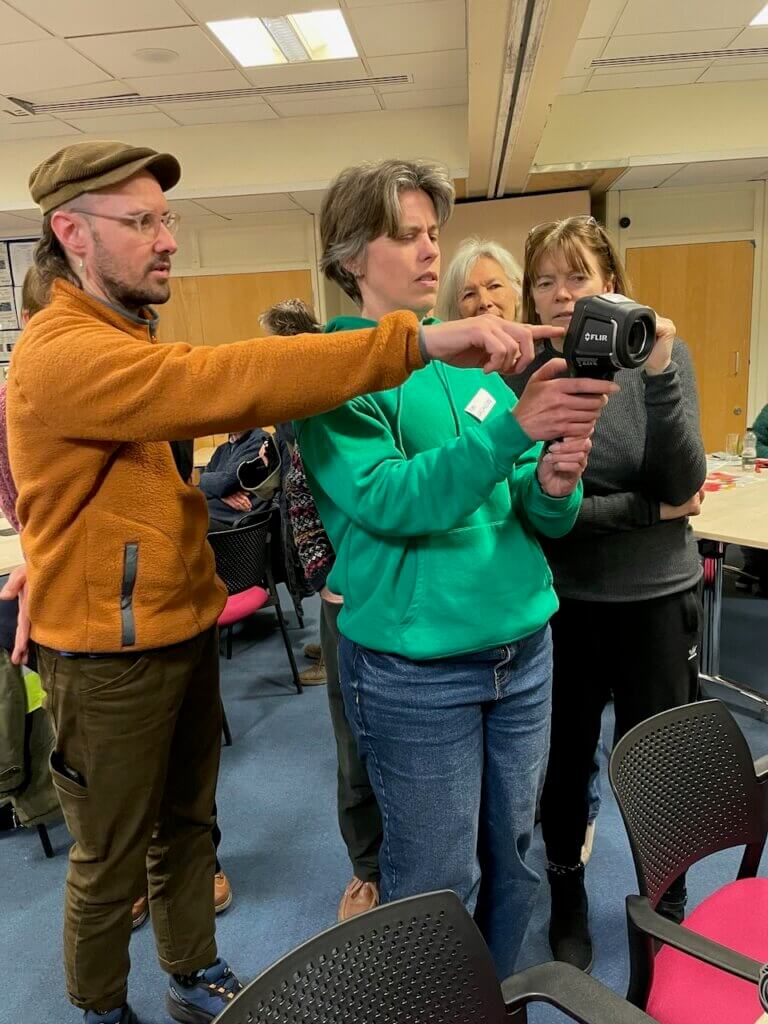
Low Carbon Hub now has two thermal cameras available for community groups to borrow and they were in action at the workshop for hands-on experimenting.
How thermal imaging cameras work
A thermal imaging camera enables you to see heat leaking from, or cold air entering your house via colour-coded images, highlighting temperature differences. The camera works by detecting the infra-red light emitted by a building, using it to determine the temperature of the surface of walls, windows, doors, and roofs.
The camera can highlight where there might be insufficient loft and wall insulation, gaps in floorboards, draughts around windows and badly fitted loft hatches, which all allow heat to escape, meaning you use more fuel to keep your house warm.
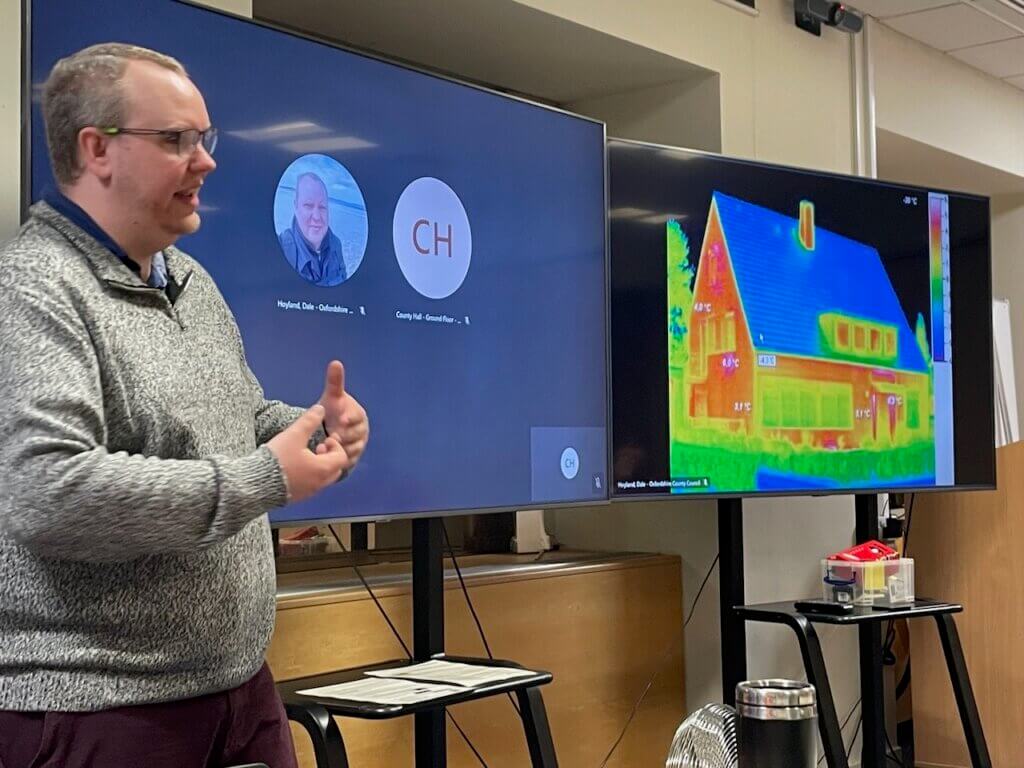
Objects at different temperatures emit varying amounts of infra-red light and a thermal imaging camera translates these differences into an image, using a range of colours representing cool to hot temperatures. Areas that are white, red, orange, and yellow indicate warmer temperatures, where heat and infrared radiation is emitted and warmth is being lost, while the purples and dark blue/black areas indicate cooler temperatures. From outside, a thermal image of a house will typically show a large patch of red under a bay window, where there is a radiator but little or no insulation in the wall.
Training workshop
Dale took us through a slide presentation to understand the technical aspects of the camera and the optimum conditions for thermal imaging:
- Having the right weather conditions for thermal imaging can really help, so it is best to plan your project in the early Autumn to make the most of the cold winter.
- The ideal time for imaging is a cold, dry night, four hours after sunset, with no rainfall in the previous 24 hours and no strong wind.
- The temperature difference between inside and outside is important and ideally should be a minimum of 10c – 15c.
- It’s helpful if residents set their central heating system to operate 2-4 hours before, so that they have an average inside temperature of at least 18°C.
The workshop was interactive, and the community groups had fun supporting each other while experimenting with the thermal cameras, and shared tips and expertise.
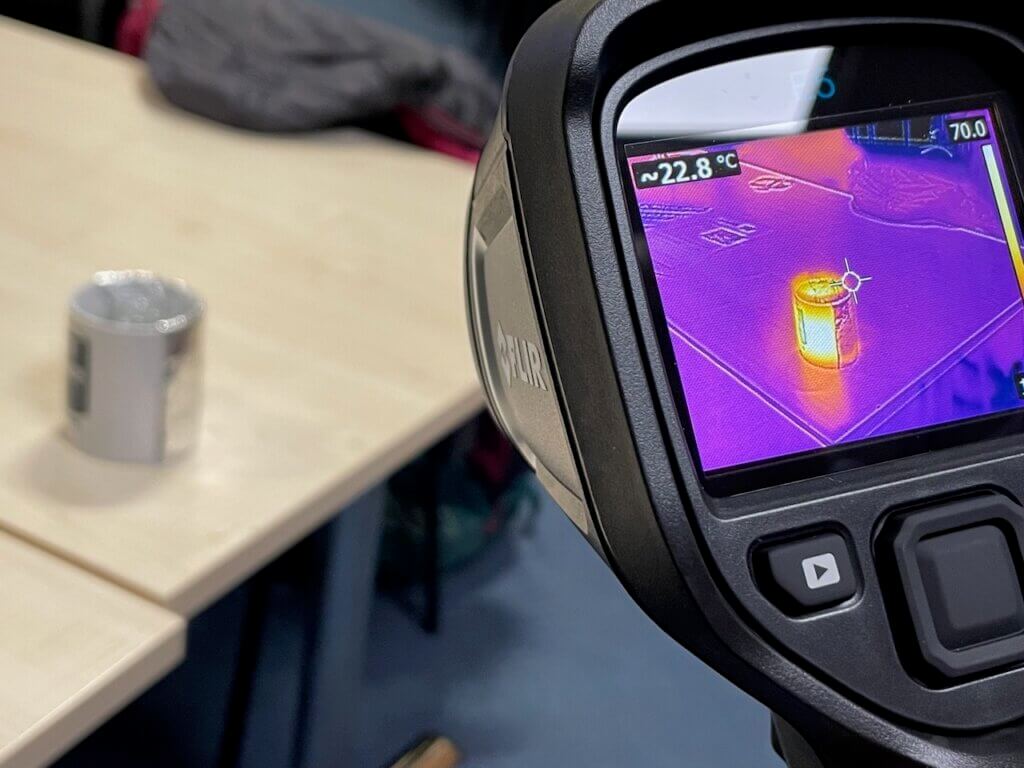
Dale illustrated one of the basic principles of thermal imaging; that metals are poor emitters of heat, with a simple, practical experiment. He covered half of an empty mug with aluminium foil, filled it up with hot water and several participants took a thermal image. Aluminium foil and glass block infra-red rays, and it was interesting to see how starkly the foil wrapped part of the mug showed up on the thermal image as dark blue.
It is important to let residents know that their privacy is safe during the thermal imaging session, as infra-red radiation cannot pass through glass and the camera cannot see through the windows, doors, or walls. When a thermal camera is pointed at a window, only a reflected temperature of the objects can be seen, rather than seeing through it.
The next stage of a thermal imaging project is ideally to arrange a meeting to provide residents with the thermal images of their homes and feedback on the results.
Dale and some of the experienced community groups suggested an evaluation questionnaire could be sent to participants to evaluate and measure the impact of the project.
The thermal image interpretations can be used as a basis to provide residents with general advice on how they might make their home warmer, save money on their energy bills, and reduce their carbon emissions.
Dale took us through some of the affordable energy efficiency measures that could be offered in a feedback session:
- Cavity wall insulation can save up to 25% of heat loss from a house
- Solid walls, particularly underneath single bay windows, can be clad with insulating materials.
- Insulating the loft with the recommended 300mm of insulation can save up to 20% of heat loss from a house. It is important to make sure the insulation goes right up to the edge as the smallest gap can lose a significant amount of heat.
- Stop draughts from doors and windows with draught excluding tape and fabric draught excluders along the bottom of doors or letter box brushes.
- Cover doors and window with thick curtains, especially French windows. You can buy ready-made thermal curtains or sew in thermal liners.
- Radiator foil behind radiators reflects the heat back into the room, rather than allowing it to escape through the walls.
- Thermostatic radiator valves can be fitted which give more temperature control.
Resident who are interested in larger measures were encouraged to contact Cosy Homes Oxfordshire as a great first step to finding out more about retrofit measures.
Due to popular demand we will be repeating the workshop in the Autumn 2023.
More energy saving tips and advice can be found on the Energy Advice section of the Low Carbon Hub’s website here.
The CAG Network’s Guide to Thermal Imaging can be found here.
Dale Hoyland’s Quick Guide to Interpreting Thermal Images can be found here.